Technology should help us understand why outcomes occur—not simply give us better charts of those outcomes.
I have been running a little experiment on myself.
Not because I need more data. I already have plenty of data.
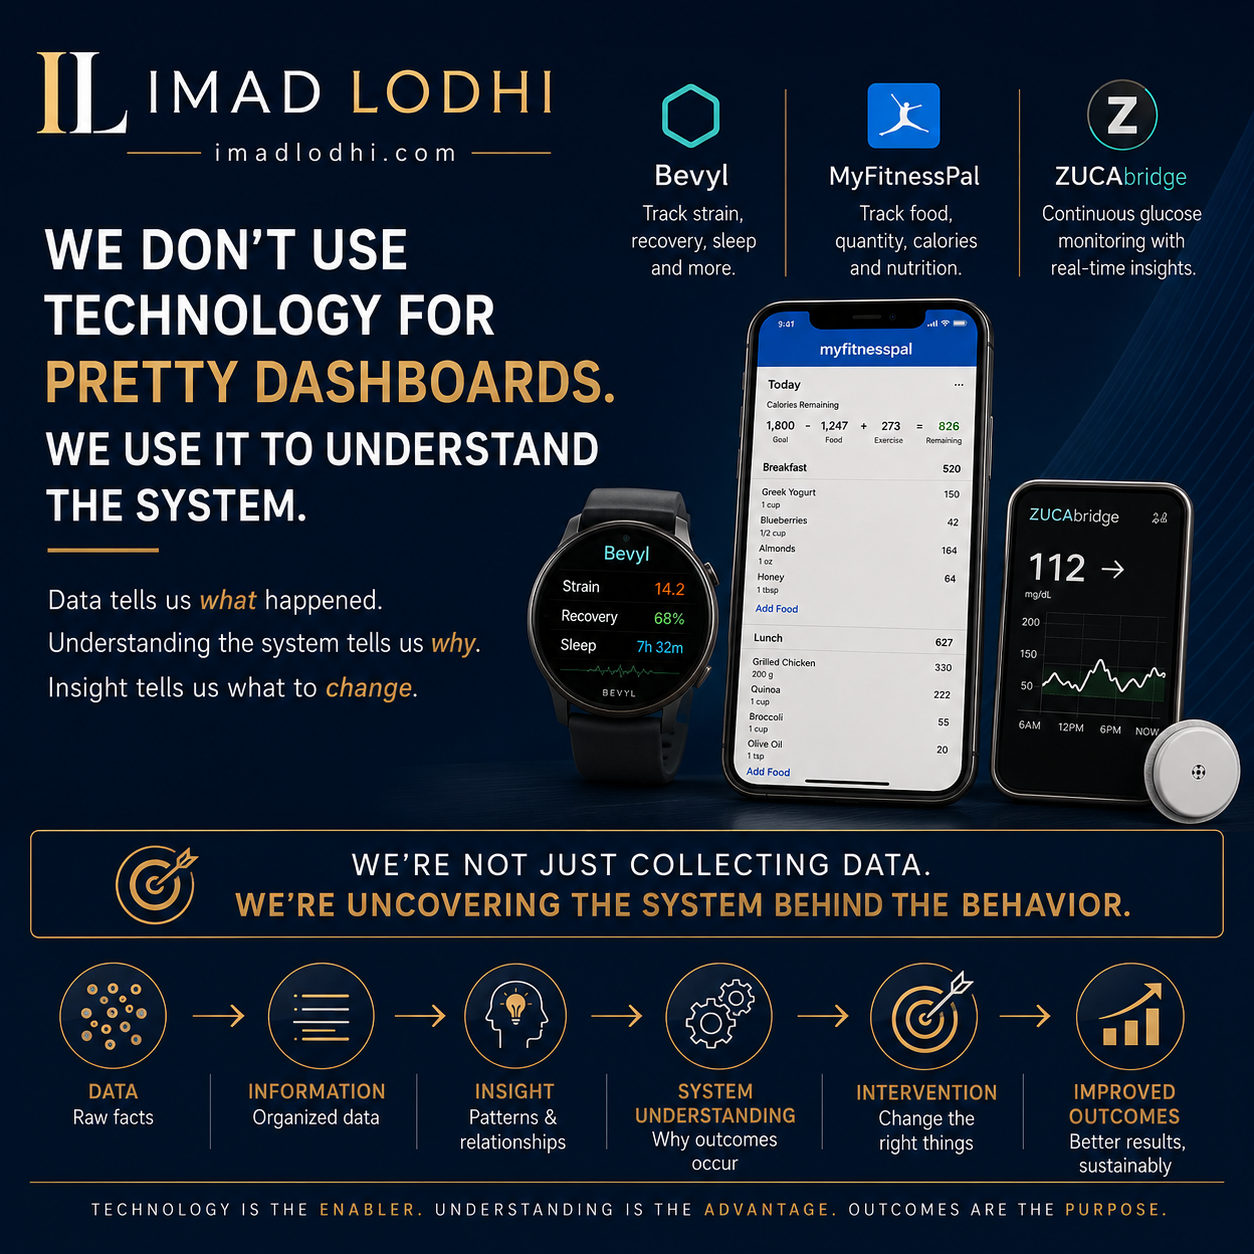
I’m using several technologies to observe different parts of my daily life.
My wearable tracks things like sleep, strain and recovery.
MyFitnessPal tracks what I eat, how much I eat and the calories associated with it.
My continuous glucose monitor gives me another stream of information: what happens to my blood glucose throughout the day and, importantly, how it responds to different foods, quantities, timing and activity.
Individually, each platform gives me interesting metrics.
But I’m increasingly realizing that the metrics themselves aren't particularly interesting.
The system producing them is.
The Dashboard Isn't the Problem
It would be very easy to turn all of this into a data exercise.
Average my glucose. Graph my sleep. Track calories. Compare recovery scores. Calculate trends. Build a dashboard.
Maybe even throw some AI at it and produce an impressive weekly report.
But then what?
Knowing that I slept poorly doesn't necessarily help me sleep better. Knowing that my glucose increased after a meal doesn't necessarily change what I eat tomorrow. Knowing that I consumed too many calories doesn't explain why I made those choices.
The more interesting questions are upstream.
What system produced those outcomes?
Looking Behind the Numbers
Consider food.
MyFitnessPal can tell me that I ate a particular food. It can tell me how many calories it contained. My glucose monitor can then show me what happened afterward.
But neither number, by itself, explains the behaviour.
Why did I select that food? Was I actually hungry? Had I skipped a meal? Was I tired? Was convenient food sitting in front of me? Did I make a different decision because I was stressed? Did poor sleep earlier in the day influence hunger or decision-making? Did the quantity change because I waited too long to eat?
Now the technology becomes much more interesting.
We're moving from What happened? to Why did it happen? and eventually What can I change in the system so that a different outcome becomes more likely?
That is a very different use of technology.
This Is Exactly What We Get Wrong in IT Operations
Think about a Service Desk.
We collect enormous amounts of operational data: Average Handle Time, First Call Resolution, Customer Satisfaction, Abandonment, Backlog, SLA attainment and Escalations.
We put those metrics into increasingly sophisticated dashboards.
Then someone sees: First Call Resolution dropped from 72% to 64%.
The meeting immediately becomes about the number.
“Why is FCR down?” “Who owns this?” “What are we doing to get it back to target?”
But FCR isn't really the problem.
FCR is the output of a system.
That system includes analyst skills, training, knowledge articles, tooling, access rights, incident complexity, ticket routing, staffing, escalation paths, application stability and dozens of other variables.
You can pressure the Service Desk manager to improve FCR all you want. But if analysts don't have the knowledge, tools, permissions or training required to resolve incidents at first contact, the dashboard isn't identifying the problem.
It's simply documenting the consequence.
From Measurement to Observability
This is where I think our use of technology needs to evolve.
We have become very good at measurement. We need to become much better at observability.
Measurement tells us what happened.
Observability helps us understand what is happening inside the system that produced it.
And analytics should help us determine which variables matter enough to change.
Otherwise organizations spend millions building beautiful dashboards that provide increasingly precise descriptions of problems they already know they have.
The dashboard turns red. Everyone discusses the red box. Someone creates an action plan to make the box green.
But nobody redesigns the system producing the red box.
Technology Should Shorten the Distance Between Insight and Action
That is what I'm finding interesting about my own experiment.
I don't want a better graph of my behaviour. I want technology to help me understand it.
If poor sleep influences food choices, and food choices influence glucose, and exercise influences both glucose and recovery, and recovery influences tomorrow's activity, then these aren't independent metrics.
They are interacting components of a system.
That changes the question completely.
Instead of asking, “How do I improve this metric?” I can ask, “What part of the system should I change to improve the outcome?”
That is the question I think technology should increasingly help us answer—whether we're talking about personal health, a Service Desk, a supply chain, employee engagement or enterprise operations.
Because the objective isn't to collect more data. It isn't to build another dashboard. And it certainly isn't to admire the analytics.
The objective is to understand the system well enough to change its behaviour.
Key Takeaways
- Metrics are outputs. They tell us something happened, not necessarily why.
- Dashboards provide visibility, not automatically understanding.
- Look upstream. Outcomes are usually produced by interacting processes, behaviours, constraints and environmental factors.
- Connect data across systems. Relationships between variables can be more valuable than individual measurements.
- Move from reporting to observability. Use technology to understand how the underlying system behaves.
- Insight should lead to intervention. The ultimate value of analytics is changing the system so better outcomes become more likely.
The most valuable dashboard may not be the one that tells you your metric is red.
It may be the technology that helps you understand why it became red in the first place.